The ENVIROMUX® Enterprise Environment Monitoring Systems graph data from their sensors using MRTG
ENVIROMUX® Enterprise Environment Monitoring Systems Graph Critical Environment Conditions with MRTG
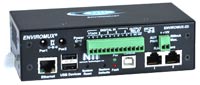
ENVIROMUX-2D

ENVIROMUX-5D
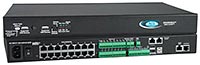
ENVIROMUX-16D
The ENVIROMUX-2D, ENVIROMUX-5D and ENVIROMUX-16D Monitoring environmental conditions around servers, work stations or data centers helps prevent the damages caused to valuable equipment by environmental conditions like temperature, humidity, water leakage etc.
The Network Technologies Inc ENVIROMUX® Enterprise Environment Monitoring Systems monitors critical environmental conditions, such as temperature, humidity, liquid water presence, power, intrusion, and smoke. When a sensor goes out of range of a configurable threshold, the system will notify you via email, LEDs, alarm beacon, siren, web page, network management (SNMP), voice phone calls (via Automatic Voice Dialer System), and SMS messages (via external USB 3G modem).
Graphing using MRTG (Multi Router Traffic Grapher) provides a visual representation of the critical environmental conditions being monitored. MRTG generates HTML pages containing regularly updated PNG images providing graphical trending of time-series data. The graphs display daily, weekly, monthly and yearly statistics of the environmental conditions being monitored.
Sample Graphs
Internal Temperature: Daily Graph (5 Minute Average)
| Max | Average | Current | ||
| 73.7 °F | 71.1 °F | 73.7 °F |
Internal Temperature: Weekly Graph (30 Minute Average)
| Max | Average | Current | ||
| 73.5 °F | 71.6 °F | 73.4 °F |
Configuration
Configure MRTG to graph environmental conditions using the ENVIROMUX Enterprise Environment Monitoring System:1) Install MRTG on your computer using the MRTG installation guide.
- Installation procedure is available at:
2) Configure the ENVIROMUX server environment monitoring system to monitor the environmental conditions you want.
3) Create a MRTG configuration file that controls the graphs.
- Download the ENVIROMUX-16D configmaker for MRTG
- Download the ENVIROMUX-5D configmaker for MRTG
- Download the ENVIROMUX-2D configmaker for MRTG
- How to use the ENVIROMUX-xD configmaker for MRTG
- Sample mrtg.cfg file created using the enviromux-16d.cfgmaker script
- Note: You can also edit the summary HTML file below to display data from the sensors you use.
- Simply replace ENVIROMUX-xD in the title and table tag to the ENVIROMUX unit you are using.
5) Create a cron job to run MRTG on UNIX machines. Use a daemon on Windows.
6) Modify MRTG graphs.
- The default graphs generated by the MRTG configuration script can be modified. Following are examples of changes to the graphs that can be made.